The Statistics Tool outputs a summary of the data from its input tool. It is useful to get an overview of the values contained in a data set. The output of the Statistics Tool contains the specific columns you have chosen as well as the statistic calculated for each of those.
The options window for the Statistics Tool looks like this:
The "Split my data before calculating statistics" option allows you to pick the columns you want to see along side the statistics you wish to see calculated.
Here you can control which statistics you would like QueryTree to calculate. Their meanings are as follows:
- Number: This counts the number of results in your data table. For example, if you have a database of orders each with an Order ID, Number will simply give you the number of orders.
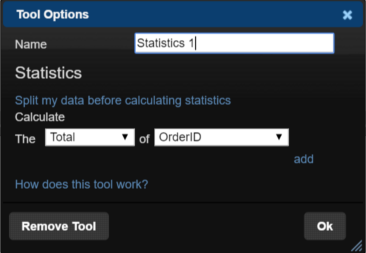
- Total: Again let's say you have a database of orders with the quantities of products for each order. Choosing Total of "Quantity" will give you the total quantity of orders made.
- Minimum: For number columns, this will be the minimum of all values in the specified column. For non-number columns this will be empty.
- Maximum: For number columns, this will be the maximum of all values in the specified column. For non-number columns, this will be empty.
- Average: For number columns this will be the average (mean) of all values in the specified column. For non-number columns, this will be empty.
- Median: For number columns, this will be the median value of all values in the specified column. For non-number columns, this will be empty.
Useful Statistics Recipes
The following are a couple of examples to show how the Statistics Tool can be used.
Example 1
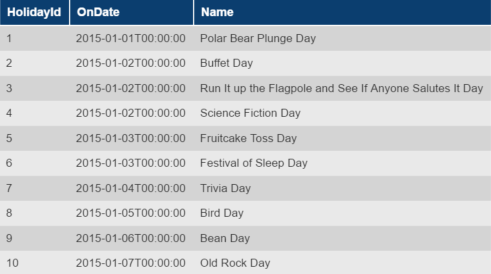
We have a table showing a list of fun holidays for each day of the year. There are some days of the year where there are multiple holidays. So we want to look at the number of holidays for each day of the year.
Here is our original table:
Below, you'll see what the Tool Options window looks:
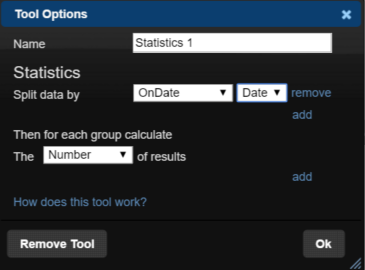
As you can see, we've chosen to "split" the data by the column 'On Date'. Next to that is a second drop down menu which will only appear when splitting data by columns that contain dates. It allows you to display the dates in the column source either by: date, month or year.
The bottom half of the tools options pop-up is where we choose which statistic we want to calculate. As we are looking for the number of holidays for each day of the year, we choose Number.
From this, we get the following table:
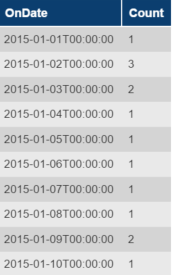
This gives us a table which displays each date of the year with the number of holidays on each day alongside it in the 'Count' column.
Example 2
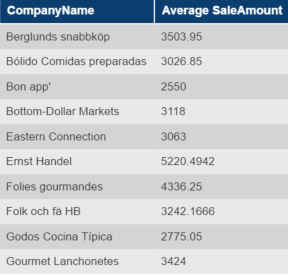
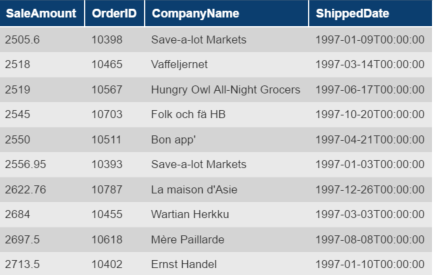
In this example we have a data table that contains the amount on sales, with Order ID's, for a number of different companies. We're going to calculate the average number of sales for each company that is listed in the table.
Here is a section of the table we are going to use:
This is what our Tools Option's pop-up looks like:
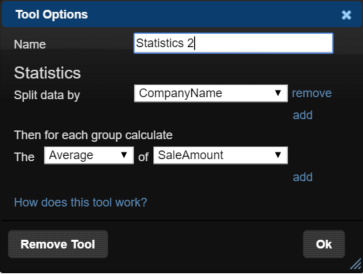
Here we have chosen to "split" the data by 'Company Name'. In the bottom half of the Tools Options window you can see we have chosen to calculate the Average of the 'Sales Amount'. This will produce a table displaying each company name in one column, and the averages sales for each company in another column. Like so: