Once you've signed up for QueryTree you can take a Test Drive using the Test Database Connection. This allows you to create some reports using our test data. The Test Drive gives you complete functionality for a full 14 days.
Watch our video and read our guide to get a full overview of the Simple Report Builder wizard.
1. Starting the Test Drive takes you to the Build your report page where you will see the Simple Report Builder. Here you can explore the database and build your first report.
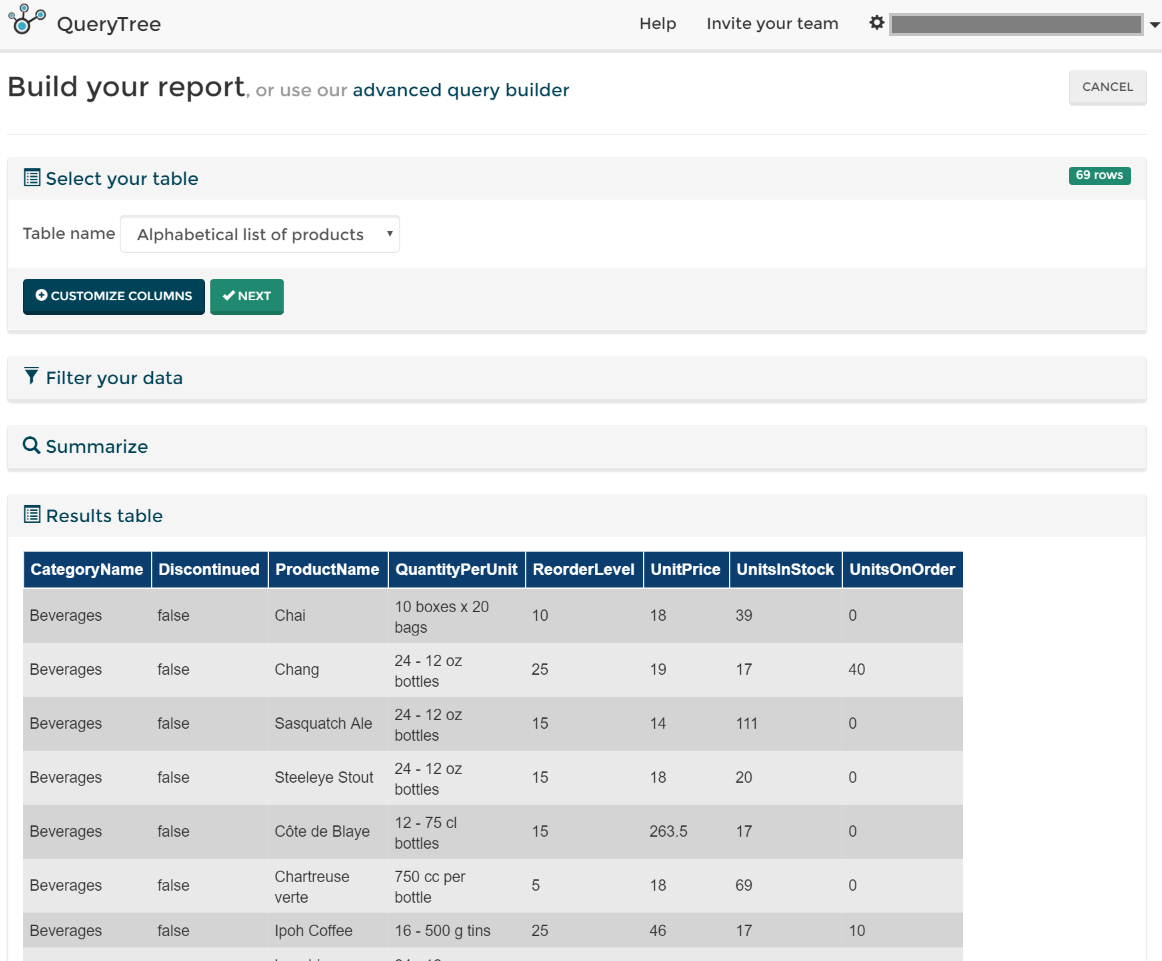
Databases are made up of one or more tables of information, so all reports start with one of these tables. To begin, use the dropdown menu in the Select Your Table panel to choose the table that you would like to work with. Then click Next. For now we will use the "Alphabetical list of products" data table.
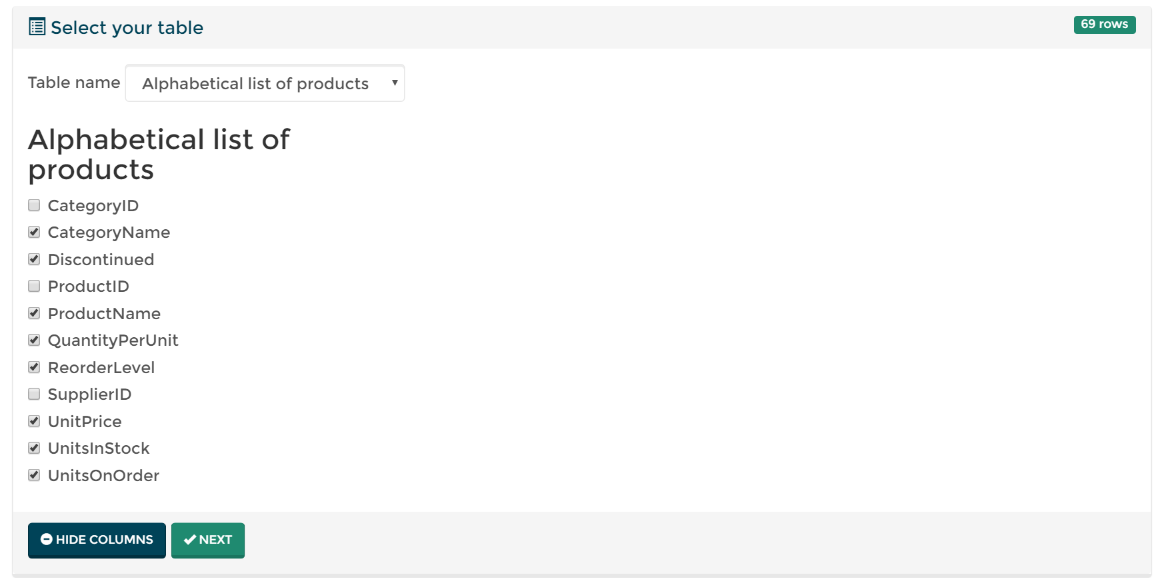
2. As you can see there is a Customize Columns button. Clicking on this allows you to see all of the columns within that table and to select specific columns:
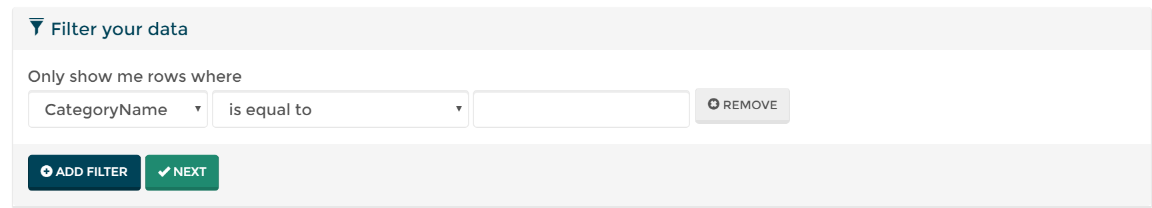
3. Clicking Next takes you to the Filter your data panel. Here you can add filters to sift through your data, giving you the exact information that you require. Pressing Add Filter will create a row for you from which you can choose the column name(s) you want to look at, as well as the filter type:
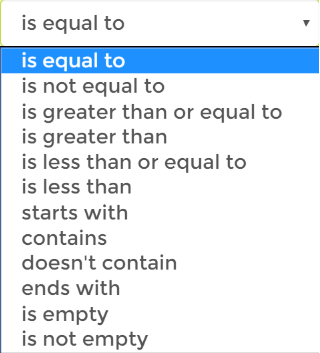
There are 12 different filter types you can use and these are shown below:
There is also the option to skip the filter panel and go straight to the Summarize panel. You can get to this panel by clicking the Next button on the filter panel.
4. The Summarize panel gives you the option to calculate statistics from the data in your table. You can choose the type of calculation you wish to see as well as a breakdown of it (this is in relation to another column within your table).
There are 6 different calculation types:
- Number
- Total
- Minimum
- Maximum
- Average
- Median
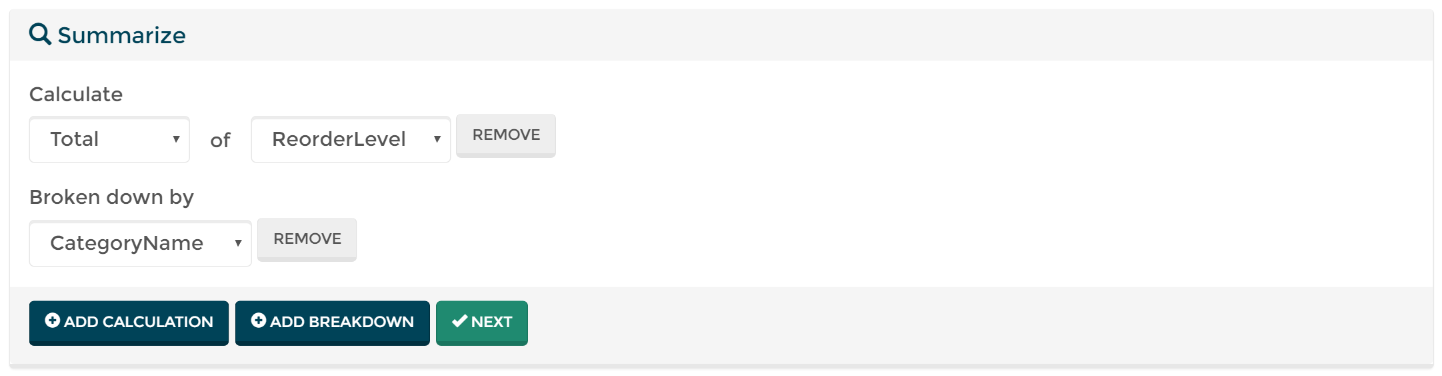
The Add Calculation button creates a row for you where you can choose the summarize type and also the column the calculation should be carried out for.
The Add Breakdown button gives you the option to breakdown the calculation using another column.
To clarify, for the above example the calculation will produce the total of each reorder level for each category present in the table (the table below shows the results produced).
5. Clicking Next will finally take you to the Results Table panel where you will see a table populated with data relevant to the filters and calculations that you have applied.
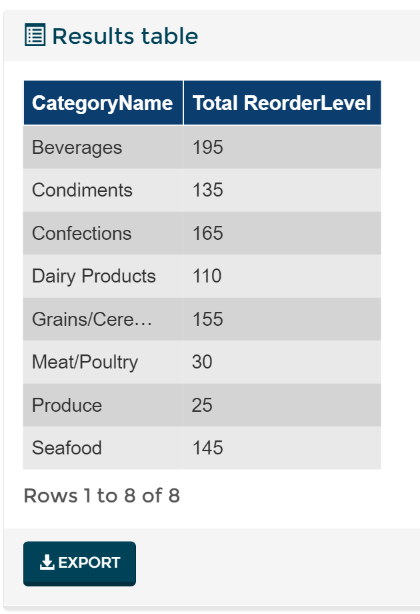
As you can see there is an Export button which allows you to download the table that's produced as a .CSV file. You can open this in any spreadsheet application e.g. Microsoft Excel.
Example Report 1
We have put together a few examples of how to use the Simple Report Builder to help you get started. Take a look and try them for yourself.
1. Once you've logged into your account and started the Test Drive you can choose a table to work with from the Select your table panel. For this example, we'll be using the Orders table to filter orders from a specific country. We'll then calculate some statistics from the resulting data table.
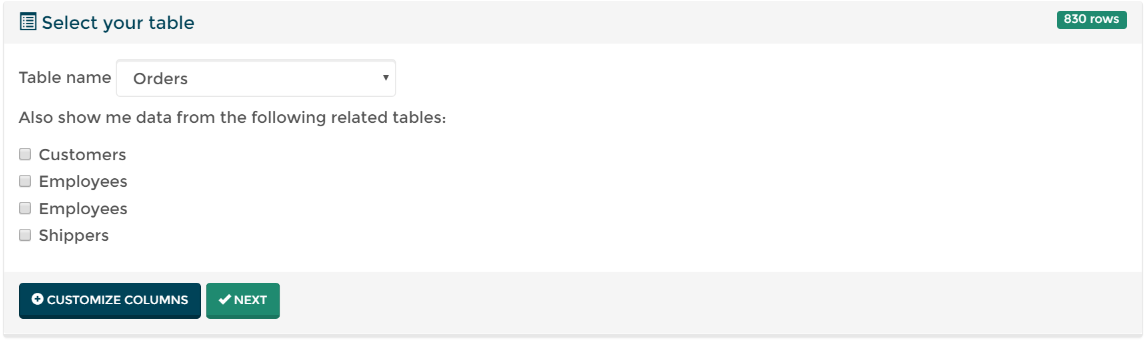
Underneath the dropdown menu that allows you to choose the data table you'll see a list of related tables. This gives you the option to join other tables to the data table that you are already working with. For this example, we will leave all of the checkboxes unticked.
2. Once you've chosen the Orders table, you can click Next and the Filter your data panel will expand. Clicking Add Filter will bring up a blank row which allows you to pick the column you want to filter, the filter type and a text box to specify the information you want. For our report we'll pick the column "Ship Country" with the filter type "contains" and in the text box enter "germa". In our resulting table we should see orders only from Germany.

3. Once you click Next you'll notice in the Results Table panel at the bottom of the page that the results table has updated to only show rows that have a "Ship Country" of Germany. At the same time the Summarize panel will expand and you can add a calculation(s) to further sift through your data. For now, we'll add the following calculation:
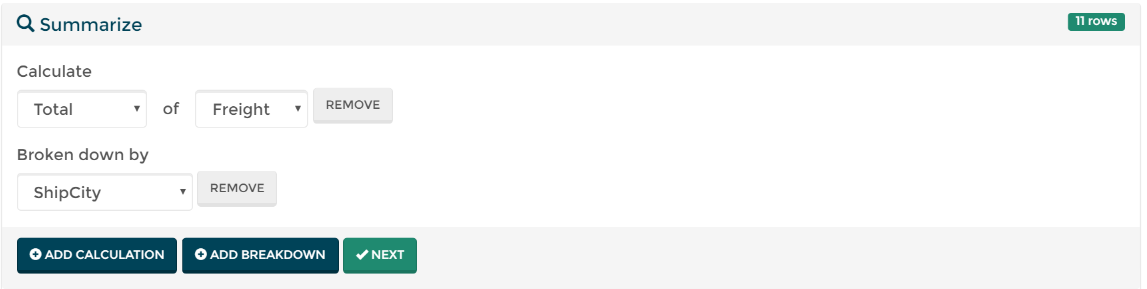
Clicking Add Calculation creates a blank row where you can use one of the calculation types in relation to a column that you can specify.
Clicking Add Breakdown then allows you to look at the statistic produced but broken down by another column type.
Simply put, the options we have chosen allow us to see the total freight per city. Remembering the filter that we added before, this means our results table will shows us the total freight per city for all cities in Germany.
You'll be able to see the resulting data table once you've clicked Next in the Summarize panel:

4. The Export button at the bottom of the panel gives you the option to save your data, allowing you to use it whenever you want! The file will be saved as a .CSV file which you can then open in any spreadsheet application, e.g. Microsoft Excel.