For many years data reporting has been lost in translation. It’s typically worked like this:
- A non-technical person wants to know some information so they can make sense of what’s happening with their app, marketing, or business. But it’s locked away in a database and they don’t have the skills to access it.
- They go to the only database reporting tool they know: they ask the developer with the coding skills to ask the database.
- To do this the non-technical person needs to translate the ideas of what they want to know into concrete questions. The developer then needs to translate those concrete questions into queries that the database understands. The developer might add in some extra queries for other possibly-relevant information.
- The database crunches through the queries and produces a database report. The non-technical person receives this report, usually with a lot more data fields than they had in mind, and must interpret it based on their original need for information.
This is all wrong.
The fundamental ingredients for exceptional database reporting: numbers and context
Numbers
When it comes to data we usually want to know the numbers first.
- “How many users did we get last week?”
- “How many leads did March’s email campaign give us?”
- “How much was last year’s revenue?”
This makes sense. Numbers help us answer the most pressing questions to do with growth and help us gauge whether we’re meeting our KPIs (or not). These questions are simple and can be easily grouped together to give broad overviews.
When it comes to reporting, numbers are straightforward and hard to misinterpret – from both a developer’s and non-technical person’s point of view. For this reason, basic numbers work well with current database reporting tools and processes. It helps that these questions are usually concrete and consistent: we’re always going to want to know how many new leads or users we’ve got.
Once we’ve had the numbers and want to understand them more, what happens then?
Context
After the initial excitement (or disappointment) over whether we’ve met our goals or not we want some wider context to the numbers.
Using the number-based questions from above, below are some examples of questions that might arise about the numbers.
1. “How many users did we get last week?”
- What have they done since they signed up?
- Why did they sign up? E.g. did they use a coupon code, or come via an invite from another user?
- Who are they?
- Where (companies, location, etc.) are they from?
- When (time, day) did they sign up?
2. “How many leads did March’s email campaigns give us?”
- What number of these have fully activated and got some value from the system?
- Where (companies, location, etc.) are they from?
- Who are these leads?
- Which parts of the system have they used?
3. “How much was last year’s revenue?”
- What proportion of revenue came from each customer?
- Where in the world/country did most of the revenue come from?
- What was the biggest source of revenue?
- When was it clear we were going to break/miss last year’s revenue?
- Who are our new customers? // Who is no longer our customer?
Many of these questions are intuitive and happen only once we’ve seen the numbers. Granted, some questions can be asked in advance but it’s difficult to know what questions you’ll want to ask until you’ve seen some data.
Yes, there are processes and certain things we’ll generally want to know but on the whole making sense of data is an intuitive and ongoing process.
Data reporting tools, analysis, and context
Simply reporting data through numbers provides no or limited context about what’s happening in the data.
In some cases non-technical people might already have the context needed to understand and interpret data. In other situations they may not. Either way, context is crucial to good data analysis.
And in order to create value from your data and drive action you need to analyze it. Reporting with context aids the analysis process and improves understanding of data, becoming part of the analysis process rather than just the step before it.It also allows for data exploration and interactive analysis, allowing you to quickly reformulate your question with each new answer that emerges.
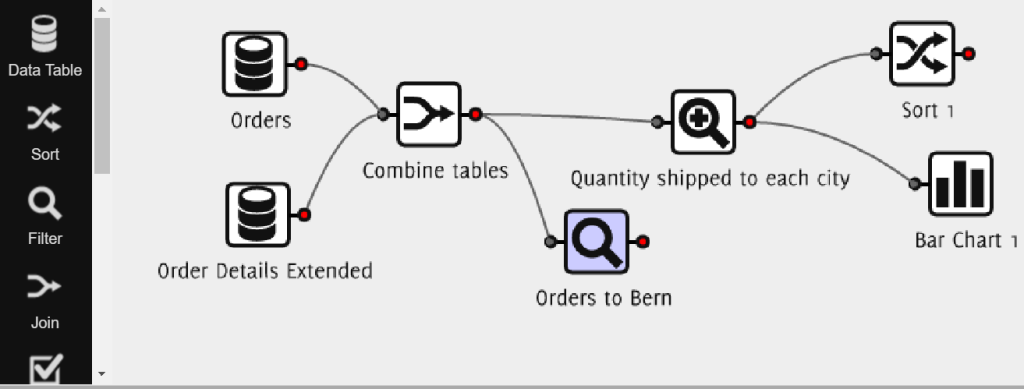
In the last few years, ad hoc reporting tools have become very good at enabling data exploration and analysis on the fly, enabling you to interactively explore and analyze your data and quickly reformulate your question with each new answer that emerges. That’s a much better database reporting tool than to-ing and fro-ing between developer and report.
By combining the reporting and analysis stages you speed up the process of creating actionable insights from your data to drive business decisions.
Take control of your data
Reporting isn’t going to answer the “so what?” question on its own. It needs to be given context to help you explain and analyze the data and ultimately make decisions.
Rather than have multiple layers of miscommunication you should be directly manipulating your data, asking questions as you work through, and creating valuable insight into your product or business.
Data doesn’t need to be complicated
QueryTree is a flexible and powerful database reporting solution that can be implemented in minutes, allowing non-technical users to build their own reports, pivot tables, and visualizations wherever and whenever they want to, without needing the help of a developer.
You can try it free for 14 days with an unlimited number of reports. Build your first report now.

