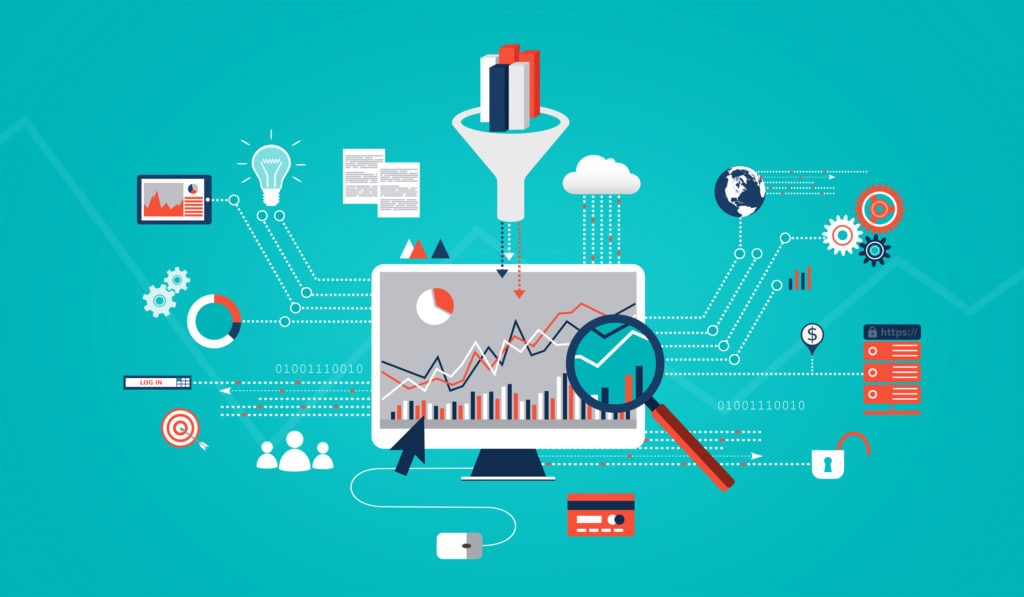
It’s never been easier to get your hands on data. Everything we do on the web or in an app leaves a data footprint and billions of connected devices are generating data at a huge rate. Between private databases, Google’s vast library of information, and various open-source datasets, we’re practically swimming in data.
The question is no longer “how can we get data on this?” but “what does this data mean?”
Data with a purpose
Data are meaningless unless given a purpose and understood in relation to your business or marketing objectives, product growth targets, or client reporting requirements.
To create value from your data assign it a purpose and actively use it to advance your mission, whatever that may be. Here are a few things data can help you achieve:
- Save costs
- Drive more revenue
- Find new sources of content
- Create new business models
- Enhance the customer experience
And so on.
Neil Isford, former VP of IBM’s Smarter Analytics, believes the ability to create meaning from data will set companies apart, driving success and growth:
“Leveraging information for business analytics, decision-making, assessing value, and ensuring seamless sharing of information will be a defining capability of the most successful companies.”
He’s not alone. During the 2016 CeBIT conference, the ability to use data was a hot topic:
“Companies that use database reporting tools are five times more likely to make decisions faster than their competitors. And 50% say data helps meet demand and facilitate growth.”
People are definitely trying to be more data-driven. The world over people are poring over data trying to figure out what it means for their business, product, or marketing strategy. Inside data reporting tools people are sifting through swathes of data looking for something that explains what they should do next. Therein lies the problem, though. Making sense of data is hard.
It doesn’t help that current database reporting tools aren’t as widespread as data collection tools, leaving volumes of data with limited means of making sense of it all.
Getting your hands on data is no longer a problem, it’s creating business value from that data that is the issue.
Make sense of your data
Many analytics solutions provide extremely in-depth data but no means to actively create value from it. It’s not uncommon to end up drowning in a sea of data, scrambling to create some meaning from this information in a database report.
Neil Isford from IBM again:
“Analytics is about providing people with trusted, relevant, and timely information to address business outcomes.”
Basically, analytics and software reporting tools should help you move toward reaching your goals by being relevant to your needs and delivering information when you need it.
It’s fantastic to have all sorts of data about all sorts of things but if only a small portion of that data is important to your current goals then why include all of it in your database report?
Focusing on the data that can help you achieve your business goals, projects, and targets is what matters. You need to get rid of the noise and drill down to what really impacts your current priorities.
 Cut out the noise and find out what you need.
Having flexible data reporting tools that empower you to filter and manipulate your data to show only relevant information is one step toward making sense of your data.
Yet database reporting tools can be time consuming, especially analyzing data and building reports. Many analytics packages and data reporting tools boast powerful options but little by way of automation.
Wouldn’t it be great if you could build a report once and receive regular updates with the most current data, automatically?
What’s your data purpose?
We’re lost in an ocean of big data – there are many tools for gathering data but a limited number for analysis and insight. But tools for creating value with your data and not just collecting the stuff are catching up.
For now, some focus on giving your data purpose and making sense of it with existing database reporting tools can help turn data into information, information into insight, and insight into action.
Create value from your data
QueryTree is a database reporting tool focused on helping your create actionable insights from your data through simple manipulation, data visualization, and scheduled reporting.
Build your first report with QueryTree. It’s completely free for 14 days with unlimited reports.

