Being able to recognise where your biggest area(s) of distribution are allows you to target more carefully those same products to customers who don't already use your business. QueryTree can sift through your data and help you identify where these areas are.
If you're new to QueryTree we recommend you start by reading our starter guide.
Here's what we'll need for our report:
- the Orders database table from our example database
- the Order Details Extended database table from our example database
- One Join tool
- One Statistics tool
The Order Details Extended database table tells us what products were ordered for a given Order ID, the quantity and a few other details.
We are interested in the number of products being shipped to each city on the list which means we need the quantity value in the Order Details Extended table.
For this we need the Join tool to combine the two tables and then the Statistics tool, which lets us pick out the information that we want.
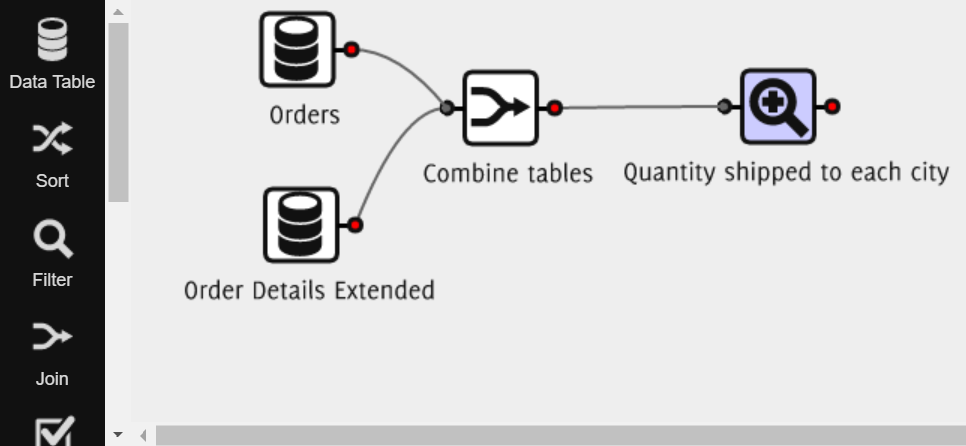
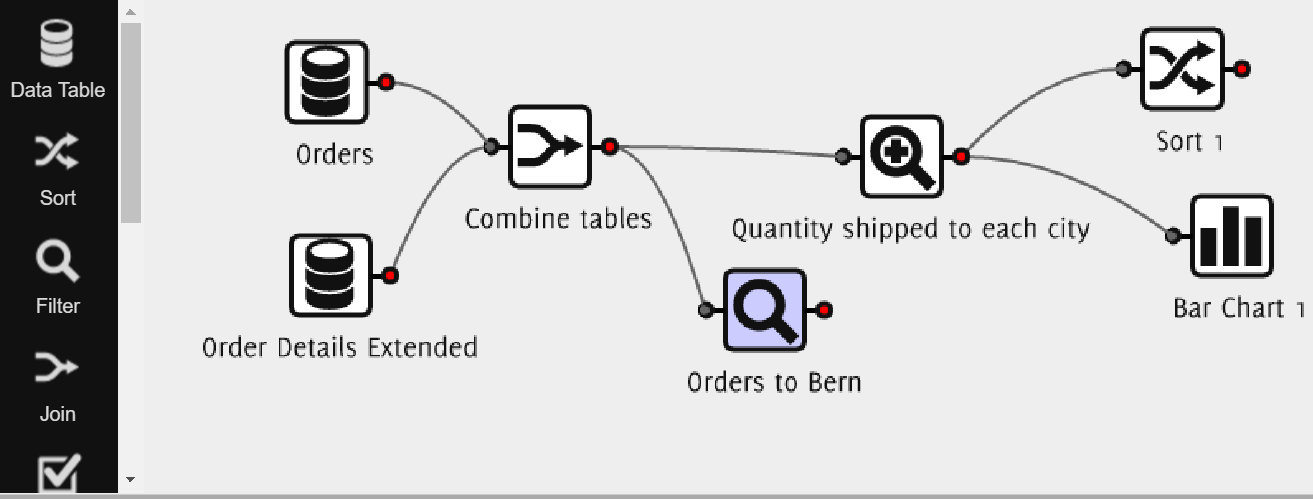
1. Your report builder needs the two database tables, the Join tool to combine them and then the Statistics tool. So this is what you'll have:
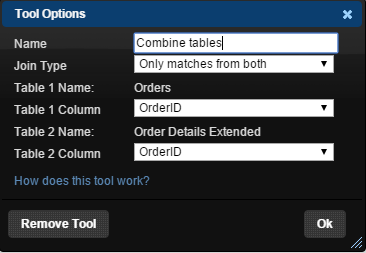
2. For the Join tool we want the following options:
- Join Type: Only matches from both
- Table 1 Column: OrderID
- Table 2 Column: OrderID
3. What this does is match up the rows from each database table that have the same Order ID. (Check out what else you can use the Join table for.) This adds the columns from the Order Details Extended table to the end of the Orders table and allows you to see the quantity ordered for each Order ID.
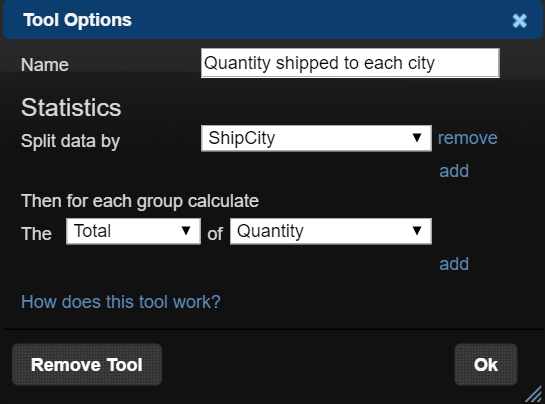
4. Finally we add the Statistics tool to our report builder. For this we want to split the data by the Ship City and then the quantities that are being shipped. So here are the options we should choose:
- Split data by: Ship City
- Calculate the: Total
- Of Column: Quantity
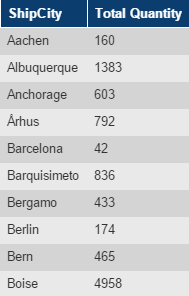
As you can see in the table above this produces a list of all the cities that orders are shipped to and the quantities that are shipped.
So there we have it! A table containing the quantity of products being shipped to each city.
One step further...
Using a Filter tool we can look at the orders that are being shipped to a particular city. For this example we'll look at Bern. We connect a Filter tool to the Join tool and this will give us a list of all the orders that have been shipped to Bern.
Now our report builder will look like this:
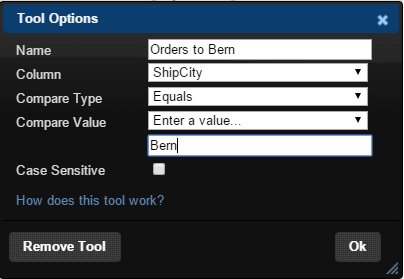
For the Filter tool we choose the following options:
- Column: ShipCity
- Compare Type: Equals
- Compare Value: Enter a value...
- Text box beneath: Bern
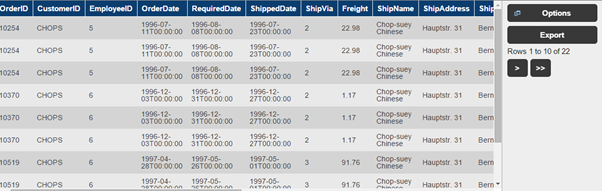
And we have our table showing all of the orders that have been shipped to Bern!
One last final step!
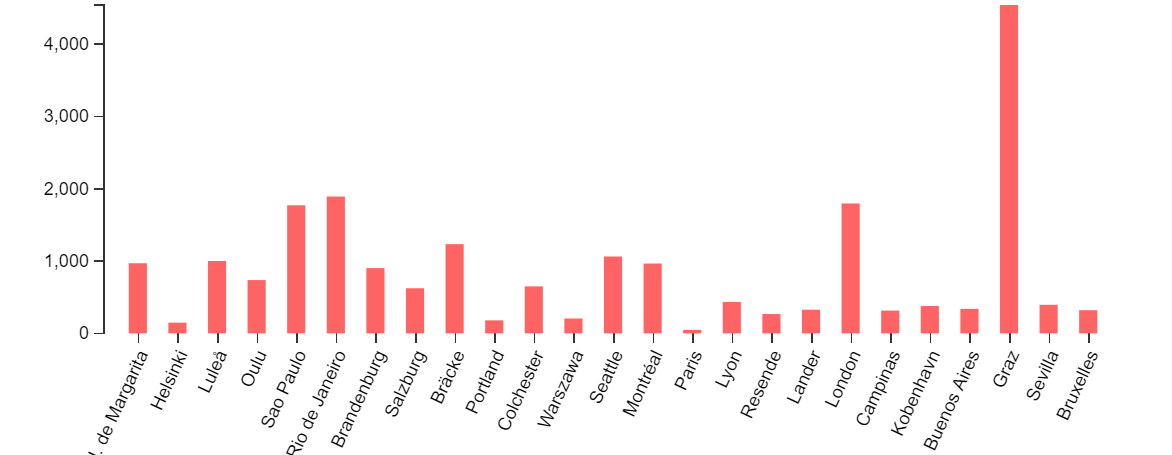
You will have noticed on the report builder there is also the addition of a Sort tool and a Bar Chart tool. The Sort tool allows you to sort the data such that the results are either ascending or descending. We will choose the descending option on the tool options window, this will list the city that has had the most orders shipped to, first. Using the Bar Chart tools means we can visualize the table that is produced after using the Statistics tool. That is, we have a bar chart which shows us the quantity shipped to each city against the name of the city itself: