If you're looking for additional features, the Advanced Report Builder provides you with all of the functionality of the Simple Report Builder and much more.
If you are already working on a report using the Simple Report Builder, you can easily convert your report to an advanced report. At the top of the Build your report page, you'll see a link that takes you to the Advanced Report Builder. If you want to jump in and create an advanced report straight away, you can do this too!
Once you've chosen to use the Advanced Report Builder, you'll see the Create Report page:

The Advanced Report Builder requires you to drag Tools on to the report builder that connect to one another and link together like a chain. These tools can be seen on the left hand side of the report builder. Check out the full list of all the tools available and how they work.
The databases are exactly the same as in the Simple Report Builder, the only difference being that to use them requires you to drag a Data Table Tool on to the report builder. If you're creating an advanced report from scratch, you'll see that we've added a Data Table Tool onto the report builder ready for you. The Tools Options pop up window then lets you pick which table you want to use as a starting point for your report.
Choose the Products table, this will load in the results area that is beneath the report builder.
Now you know about the tools you can build your first advanced report.
Example Report 1
In the following examples, we will look at how a few of the tools work. First of all, we'll begin with the Filter tool.
1. Click on the Filter tool. It looks like this:

2. Drag the tool to the right of the existing data table tool on your report builder. When it gets close to the other icon, a connection will automatically appear:
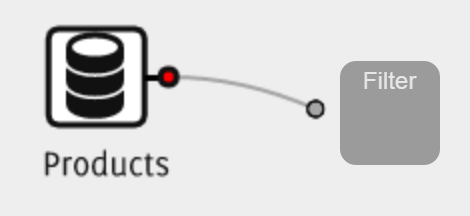
Releasing the mouse allows a connection to be made between the two tools. If they didn’t connect, that’s okay, you can drag the tool closer and try again.
3. Once connected, the Filter tool's options window will open, this will ask which rows from the Products table you would like to filter. We are going to filter out all of the products that have not been discontinued. We'll use the following options:
- Column: Discontinued
- Compare Type: Equals
- Compare Value: Enters a value...
- Text box beneath: False
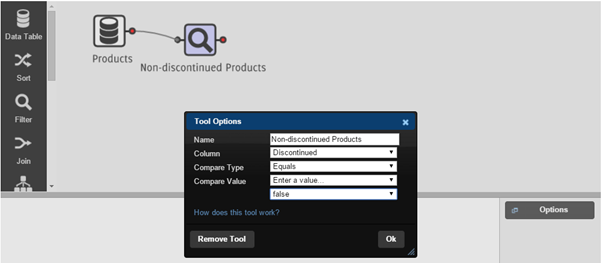
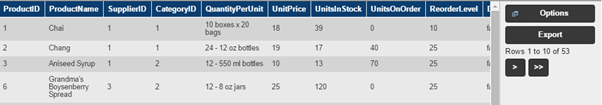
Clicking Ok will refresh the results area below the report builder and you’ll be able to see a list of all the products that have not been discontinued.
4. Now we can use the Filter tool again to see how many of these products have a Re-order Level that is above 0. We drag another Filter tool to the right of the first one and allow for a connection to be made as before.

For this filter, we will fill out the tools options window as follows:
- Column: Re-order level
- Compare Type: Not Equals
- Compare Value: Enter a value...
- Text box beneath: 0
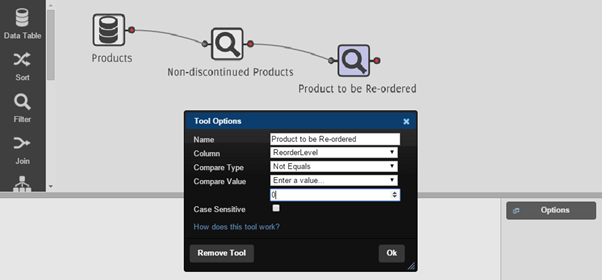
Click Ok and the results area will refresh and show you a list of the products that need to be re-ordered. This is a result of combining the two filters together.
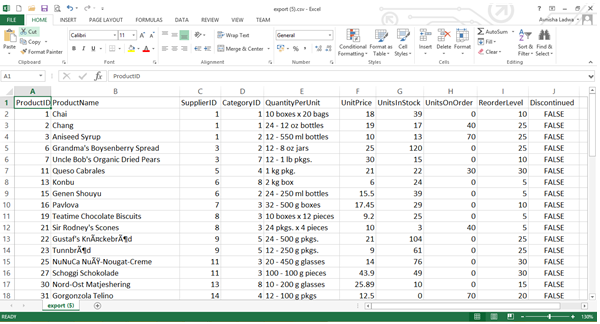
5. You can now export the data that you have and this gives you the option to share it with others. The Export button is beneath the Options button to the right of the results area.
Click Export. Depending on your browser the data will either be saved in your downloads file or you will be asked where you want to save your results. The table from the results will be saved as a .CSV file which you can open in any spreadsheet application e.g. Microsoft Excel.
Example Report 2
Now we will look at creating a bar chart. For this example we will use the Suppliers data table.
1. Drag and drop a Data Table tool on to your report builder and using the drop down menu select Suppliers.
2. Once this has been chosen, we then select and drag a Statistics tool to the right of the data table tool and allow a connection to be made. For the statistics tool choose the following options:
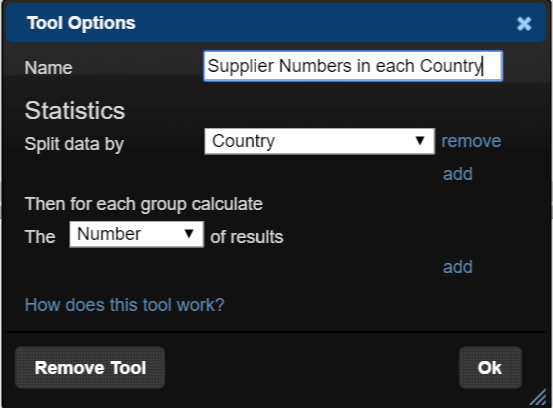
This will count the number of suppliers there are in each country listed in the table. Clicking OK produces a table in the results area (this can be exported).
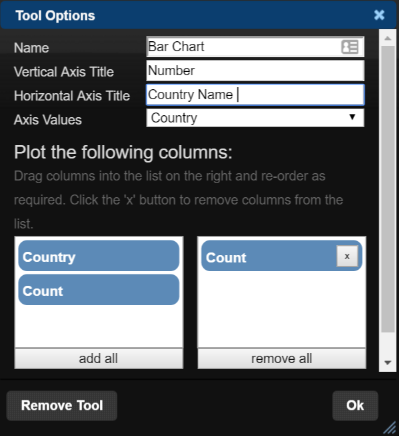
3. We then add a Bar Chart tool. Drag a Bar Chart tool to the right of the Statistics tool and allow a connection to be made.
4. The Tool Options window is shown below. Choose the following options:
- Axis Values: Country
- There are two boxes below, drag Count into the right hand box
The bar chart then appears in the results area beneath your report builder like so:
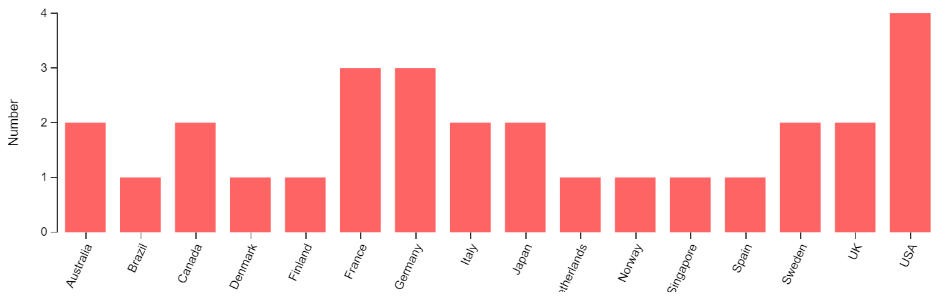
5. Again you can see the option to export (which will always be available when there is something in the results area). Click Export. An image of the bar chart will be downloaded.
Example Report 3
This report is a bit more complex and will cover a few different tools. We will start off with the Order Details data table.
1. The first tool we will use is the Filter tool. Below is the Tool Options window which shows the options we will choose:
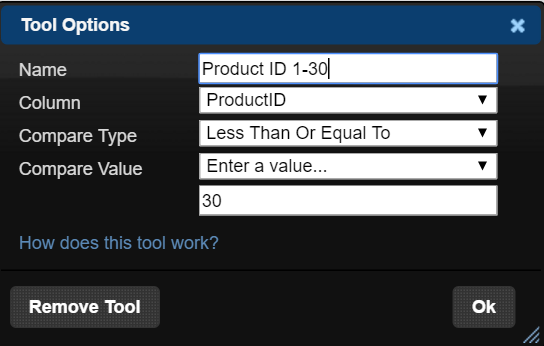
The result is a table containing all of the columns present in the Order Details table, but only for Product ID's that are in between 1-30.
2. We then add a Select tool which allows us to choose which columns we want to see, this automatically orders the Product ID's to be ascending from 1-30. Below is a section of the table we now have:
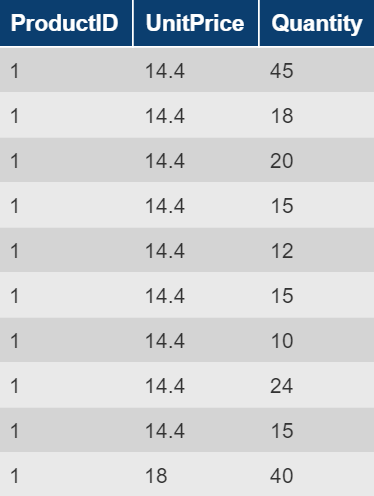
As you can see there are lots of different orders for each Product ID, so for each Product ID we want to count the total quantity ordered.
3. For this, we use the Statistics tool. Below you can see the Tool Options window:
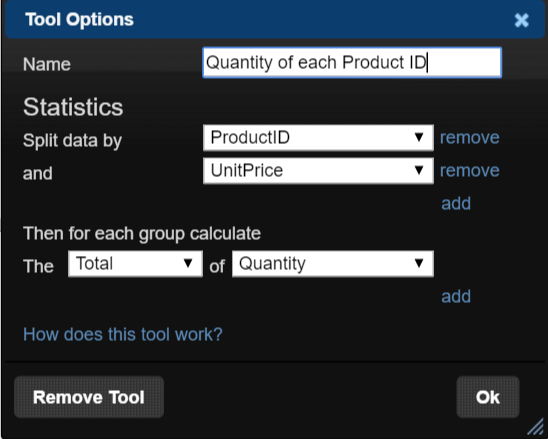
The "split data by" option allows us to choose which columns from the table we want displayed. The "then for each group calculate" is where you can choose which statistics you want calculated and these can be used for any column within the table. For the purpose of this example, we only want the total quantity ordered for each Product ID, so we only use the Total function. Check out the other uses of the Statistics tool.
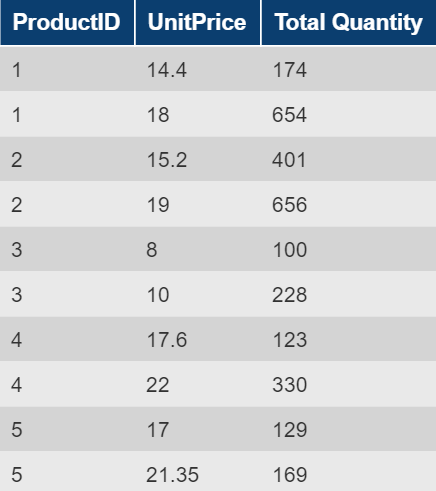
This gives us a table of the Product ID, the Unit Price and the Total Quantity for Product ID's 1-30. As we have included the Unit Price column, the resulting table displays the quantity of each Product ID ordered for each Unit Price they are ordered at. You can see a section of the table below:
4. This can then be exported into a spreadsheet and edited to suit your needs and to show the figures that you are interested in.