Knowing who your best customers are, and how much they're likely to spend per order is vital to directing your marketing efforts. If you have a database of your customers' transactions QueryTree is great at telling you all about how much they're spending.
If you're new to QueryTree we recommend you start by reading our starter guide.
For this example, we'll be using:
- the Orders database table from our example database
- the Orders Subtotals database table from our example database
- The Join tool
- The Statistics tool
- The Sort tool
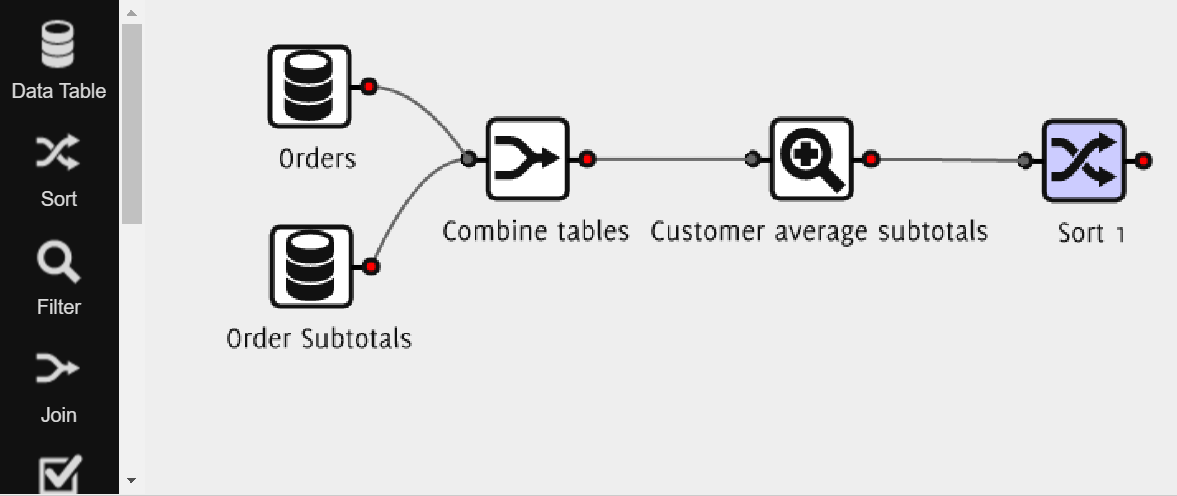
After putting our report together, here is what your report builder will look like:
1. To start, open QueryTree, go to the test database connection, and create a new report.
2. Add two data table tools, use one to load the Orders table and another to load the Order Subtotals table.
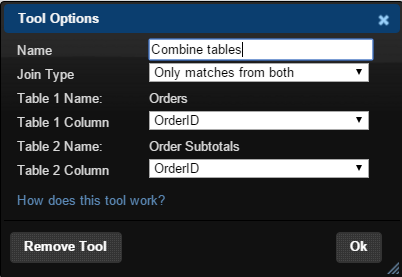
3. Next we need to join the two database tables together to give us one table that contains all the information about each order as well as the subtotals for each order.
Use the following settings on the Join tool:
- Join Type: Only matches from both
- Table 1 Column: Order ID
- Table 2 Column: Order ID
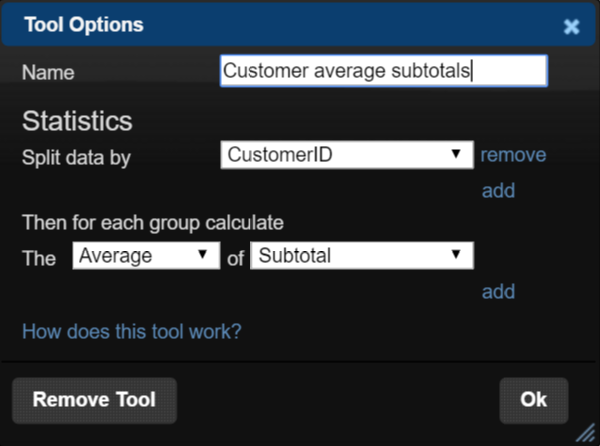
4. Next, use the Statistics tool, with the options shown below, to return a table with Customer ID's and the average order subtotal for each:
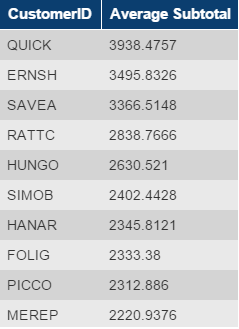
5. Using the Sort tool allows you to either see the results ascending or descending. We will choose the descending option on the tool options window. This will present the data with the highest average order per customer to the lowest. Here is the table you will get as a result of this report: