There are many uses for QueryTree. Especially if you’re creative with the type of insights you want. A tried and tested use is using QueryTree to view product data.
If you can’t use your own product to improve your own product then you shouldn’t be selling your product
Luckily for us we’ve had QueryTree plugged into QueryTree and providing us with actionable insights. One of the ways we use QueryTree is monitoring how people use the app so we can continuously improve the product.
Recently we’ve been interested in how people get on with the initial database setup. Because QueryTree is a tool aimed at non-technical users, and this is the most technical step in setting up QueryTree, it’s one of the most important stages of setup.
So, using QueryTree’s simple report builder wizard, we set up reporting to monitor this stage of the user journey.
The data showed us that some users were inputting junk information into the database connection fields. This is no good because it means the people with junk information can’t connect to their database which in turn means they can’t use QueryTree for anything. Unsurprisingly this leads to frustration on their behalf.
We thought we’d made this step as easy as possible for users of all technical abilities. But the data from QueryTree told us otherwise.
So we rebuilt the wizard to help people set up the database connections properly. Problem (hopefully) solved! We’ll keep an eye on it.
But how did we get this insight from our data?
Turning data into actionable insight using QueryTree
QueryTree is great because you can filter information to show only specific variables in reports. In this case, we specifically wanted insights into how people were using the app.
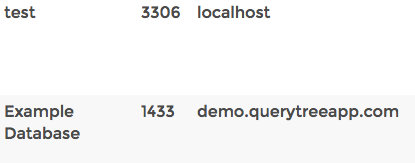
With this outcome in mind we set up some narrow data filters using our simple report builder. These filters included database name, port, and server, which would let us see if people were using the right information to connect to their databases.
Once we’d applied the filters and the report was created we were able to view our data in the table overview, making it easily-digestible.
We were looking for anything generally unusual or definitely wrong to do with connection information input by users. We found that quite a few users were putting wrong information in when trying to connect to their database, despite being guided by the wizard.
This told us that the wizard wasn’t working properly so we redesigned it to make the information needed for a successful connection clearer.
Product development from data visualization
By simply plugging QueryTree’s database into QueryTree we noticed an issue with the product. It helped that we were able to add specific data filters, removing the ‘noise’ of data we weren’t interested in at that moment in time.
Using these insights we tweaked the product, nipping product issues in the bud before they became a real problem for a majority of non-technical new users.
QueryTree is still plugged into QueryTree, gathering data and visualizing the numbers in an easy-to-view interface

